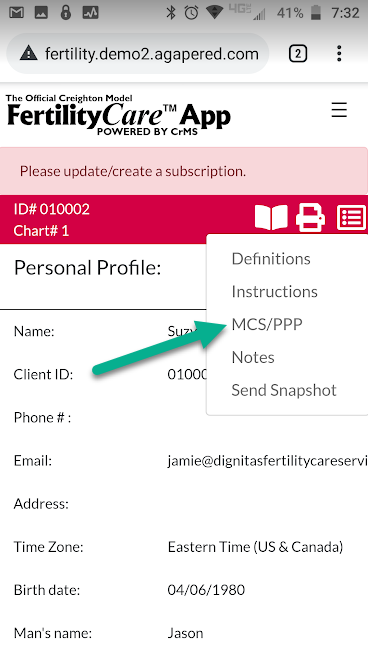
After you’ve logged in click on the menu icon ![]() and select MCS/PPP.
and select MCS/PPP.
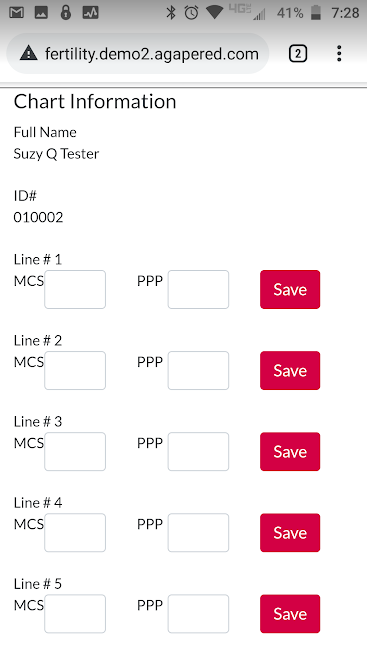
Scroll down just a little under the Print Chart and Download Chart is a section titled, Chart information, it is in this section that you can enter the Mucus Cycle Score (MCS) and Post-Peak Phase (PPP) for each Line of your Chart.
Once you’ve entered the values for the Line, click the Save icon.
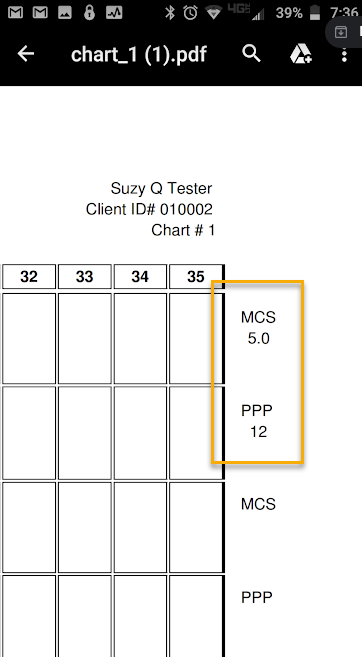
NOTE: when you print or download your chart the MCS/PPP will show at the end of the chart.